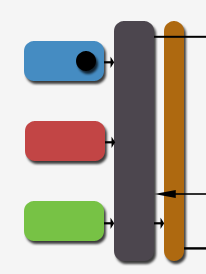
The front end of the chip concerns itself with keeping the shader core and ROP hardware as busy as possible with meaningful, non-wasteful work, sorting, organising, generating and presenting data to be worked on, and implementing pre-shading optimisations to save burning processing power on work that'll never contribute to the final result being presented. G80's front end therefore begins with logic dedicated to data assembly and preparation, organising what's being sent from the PC host to the board in order to perform the beginnings of the rendering cycle as data cascades through the chip. A thread controller then takes over, determining the work to be done in any given cycle (per thread type) before dispatching control of that to the shader clusters and their own individual schedulers that manage the data and sampler threads running there.
In terms of triangle setup, the hardware will run as high as 1 triangle/clock, with the setup hardware in the main clock domain, feeding into the raster hardware. That works on front-facing triangles only, after screenspace culling and before early-Z reject, which can throw away pixels based on a depth test apparently up to 4x as fast as any other hardware they've built, and is likely based on testing against a coarse representation of the depth buffer. Given 64 pixels per clock in G71 of Z-reject, 256-pixels per clock (and therefore the peak raster rate) is the likely figure for G80, and tallies with measurements taken with Archmark.
Our own tests rendering triangle-heavy scenes in depth-sorted order (and in reverse) don't give away much in that respect, so we defer to what NVIDIA claim and our educated guess. NVIDIA are light on details of their pre-shading optimisations, and we're unable to programatically test pre-shading reject rates in the detail we'd like, at least for the time being and because of time limitations. We'll get there. However, we're happy to speculate with decent probability that the early-Z scheme is perfectly aggressive, never shading pixels that pass the early-Z test unless pixel depth is adjusted in the pixelshader, since such adjustment would kill any early-Z scheme before it got off the ground, at least for that pixel and immediate neighbours.
The raster pattern is observed to be completely different when compared to any programmable shader NVIDIA has built before, at least as far as our tests are able to measure. We engineered a pixel shader that branches depending on pixel colour, sampling a full-screen textured quad. Adjusting the texture pattern for blocks of colour and measuring branching performance let us gather data on how the hardware is rasterising, and also let us test branch performance at the same time. Initially working with square tiles, it's apparent that pixel blocks of 16x2 are as performant as any other, therefore we surmise that a full G80 attempts to rasterise screen tiles 8 quads in size before passing them down to the shader hardware. The hardware is likely able to combine those quads for rasterisation in any reasonable pattern.
We'll go out on a limb and speculate that the early-Z depth buffer representation is based on screen tiles which the hardware then walks in 16x16 or 32x32 using defined Morton order or a Hilbert curve (fractal space filling) as a way for the chip to walk the coarse representation to decide what to reject.
As far as thread setup and issue goes, the hardware will schedule and load balance for three thread types when issuing to the local schedulers, as mentioned previously, and the scheduler hardware runs at half shader clock (675MHz in GTX, 600MHz in GTS, etc). We mentioned the hardware scaling back on thread count depending on register pressure, and we assert again that that's the case. Scaling back like that makes the hardware less able to hide sampler latency since there are less available threads around to run while that's happening, but it's the right thing for the hardware to do when faced with deminishing register resources. So performance can drop off more than expected when doing heavy texturing (dependant texture reads obviously spring to mind), with a low thread count. Threads execute per cluster, but output data when the thread is finished can be made available to any other cluster for further work.
Attribute interpolation for thread data and special function instructions are performed using combined logic in the shader core. Our testing using an issue shader tailored towards measuring performance of dependant special function ops -- and also varying counts of interpolated attributes and attribute widths -- shows what we believe to be 128 FP32 scalar interpolators, assigned 16 to a cluster (just as SPs are). It makes decent sense that attribute interpolation simply scales as a function of that unit count, so for example if 4-channel FP32 attributes are required by the shader core, the interpolators will provide them at a rate of 32 per cycle across the whole chip. We'll talk about special function rates later in the article.
Returning to thread setup, it's likely that the hardware here is just a pool of FIFOs, one per thread type, that buffers incoming per-thread data ready to be sent down the chip for processing. Threads are then dispatched from the front-end to individual per-cluster schedulers that we describe later on. Let's move on to talk about that and branching.
