Multi-Texturing vs Multi-Pass
Despite GeForce FX apparently applying two textures per pipe it can support up to 16 different texture layers per pass by cycling over each of the required texture layers over multiple clocks, also known as 'Loopback'. See here for a more detailed overview of the differences between multi-pass rendering and multi-texturing via loopback.
The Serious Sam game engine uses up to 5 texture layers, and the engine has been coded to be configurable from 1 texture per pass up to 4. We'll take a look at some results to see if they make any difference on the GeForce FX. The same setting as previously used apply here, except Bilinear filtering was in operation.
| 640x480 | 1024x768 | 1600x1200 | |
| None | 141.9 | 138.6 | 86.7 |
| Dual | 139.5 | 135.2 | 99.7 |
| Triple | 139.0 | 134.6 | 98.6 |
| Quad | 139.4 | 133.5 | 98.9 |
| Diff from None | 640x480 | 1024x768 | 1600x1200 |
| Dual | -2% | -2% | 15% |
| Triple | -2% | -3% | 14% |
| Quad | -2% | -4% | 14% |
Oddly at 640x480 and 1024x768 exclusively using single texturing appears to be the highest performance rendering method, which is a little odd. However, when we move up into a fill-rate and bandwidth limited resolution with 1600x1200 we can see that the opposite is the case. Moving from single texturing to dual texturing per pass we get a 15% performance increase. When moving to up from two texture layer per pass to more we can see there is a slight performance drop; this could, perhaps, be due to a slight inefficiency in the ‘loopback’ texturing at present – the multi-texturing fill-rate test of 3DMark also scores quite a bit lower than the theoretical performance rate, which could further highlight this. Note, that when moving from 3 texture per pass to 4 there is no extra performance increase, again indicating that the pipeline is operating with two texture layers per pixel pipe.
SPECViewperf 7.0
Here we'll take a look at the performance of the GeForce FX under the OpenGL workstation benchmark.
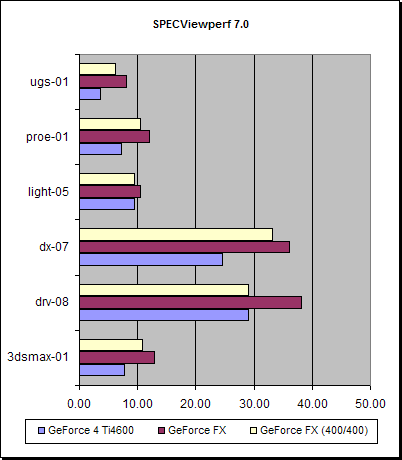
| 3dsmax-01 | drv-08 | dx-07 | light-05 | proe-01 | ugs-01 | |
| GeForce 4 Ti4600 | 7.81 | 29.04 | 24.60 | 9.37 | 7.19 | 3.65 |
| GeForce FX | 12.88 | 38.15 | 36.02 | 10.49 | 12.00 | 8.15 |
| GeForce FX (400/400) | 10.74 | 29.04 | 33.19 | 9.42 | 10.46 | 6.19 |
| % Diff from Ti4600 | 3dsmax-01 | drv-08 | dx-07 | light-05 | proe-01 | ugs-01 |
| GeForce FX | 65% | 31% | 46% | 12% | 67% | 123% |
| GeForce FX (400/400) | 37% | 0% | 35% | 1% | 45% | 70% |
Under SPECviewperf 7.0 we can see performance gains across the board for the 5800 Ultra. The various tests stress different elements of the system, some CPU and some the CPU to graphics bus, and others the onboard geometry and fill-rate performance of the graphics, which is why we see differing gains in performance for all of the boards. In the UGS test the 5800 Ultra holds quite a significant performance advantage over the Geforce4, which I would presume is down to the higher geometry processing abilities of the 5800 Ultra. In a couple of tests there appears to be no performance advantage from the 5800 running at 400/400 over the Geforce4, which is a little odd.