Games Benchmarks - OpenGLCall of DutyHere we'll look at the performance of GeForce 6800 Ultra under this Quake3 engine based title. 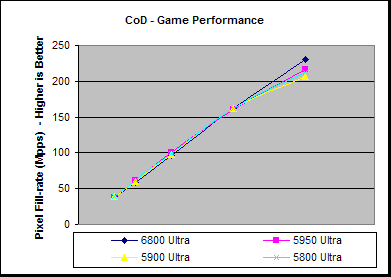
As we've seen in a number of games benchmarks, Call of Duty is nearly completely CPU bound under normal rendering. The 5950 only shows some fill-rate limitations above 1280x1024, hence only a small, 6.6%, performance gap opens up between the higher performance 6800 Ultra an the 5950. 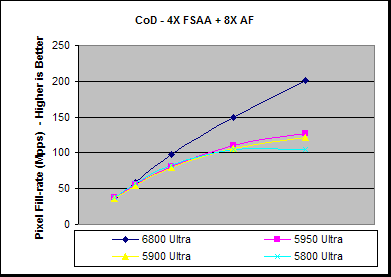
With the higher image quality settings of 4X FSAA and 8X AF enabled we can see that the 6800 Ultra and the 5950 are beginning to show some fill-rate limitations, although the 6800 Ultra isn't showing anything near the performance drop of the 5950. The performance difference between the 6800 Ultra and 5950 increases to a maximum of about 59%. 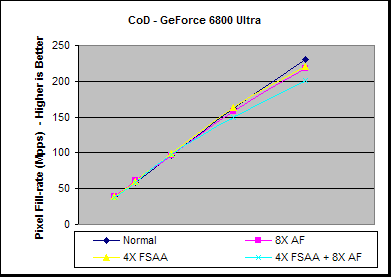
With the various settings enabled we can see just how CPU limited the 680 Ultra is in this test. In all cases the average rendering performance is above 100 FPS and even with both 4X FSAA and 8X AF enabled there is only a 13% performance drop. |
- NVIDIA Fermi GPU and Architecture Analysis
- ATI Cypress Gaming Performance Analysis
- ATI Cypress GPU and Architecture analysis
- ATI RV740 GPU and Architecture Analysis
- NVIDIA GT200 GPU and Architecture Analysis
- Q&A with Visceral's Technical Art Director Doug Brooks on Dead Space 2
- Andy Keane Interview & Tesla Adoption/Deployment
- Was Harry Potter actually into rendering? Beyond3D's first ever book review
- AMD's John Bridgman on Radeon, Linux and Open Source 3D
- Diving into Anti-Aliasing
- Ian Buck - NVIDIA Tesla Launch
- Dave Kirk - NVIDIA Tesla Launch
- E3 2011: Behind Closed Doors - Witcher 2 Xbox 360... and a Nurse
- Travelling in Style: Beyond3D's C++ AMP contest - WINNER ANNOUNCED
- A speculative look on the Wii U GPU
NV40 - GeForce 6800 Ultra Review - Page 26
Published on 14th Apr 2004, written by Dave Baumann for Consumer Graphics - Last updated: 20th Jul 2007
Page Navigation
Site width adjust
![]()
![]()
Reset width
Privacy Policy