Published on 22nd Jun 2005, written by Dave Baumann for Consumer Graphics - Last updated: 20th Jul 2007
Far Cry - HDR
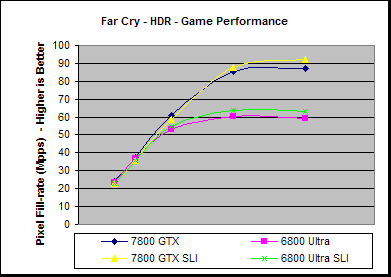
Float rendering is one of the elements that NVIDIA have concentrated on for G70, so we'll use the same Far Cry test as in the previous case, but this time with the HDR rendering mode enabled.
Far Cry - HDR (FPS)
640x480
800x600
1024x768
1280x1024
1600x1200
7800 GTX
77.6
77.6
77.3
65.3
45.3
6800 Ultra
76.6
76.6
67.8
46.0
30.7
7800 GTX SLI
74.6
74.8
74.7
67.1
47.9
6800 Ultra SLI
74.7
74.3
69.4
48.7
32.8
7800 GTX % Faster than 6800 Ultra
640x480
800x600
1024x768
1280x1024
1600x1200
Single
1.3%
1.2%
14.1%
42.0%
47.3%
SLI
0.0%
0.6%
7.6%
37.7%
45.8%
% SLI Increase
640x480
800x600
1024x768
1280x1024
1600x1200
7800 GTX
-3.8%
-3.6%
-3.4%
2.8%
5.8%
6800 Ultra
-2.5%
-3.0%
2.4%
6.0%
6.9%
Here we can see that the 7800 GTX has a maximum of a 47% performance advantage over the 6800 Ultra with HDR enabled on this Far Cry test, which is fairly large but less than the texture rate differences between the boards. We noted in our SLI article that the HDR path in Far Cry does not appear to benefit too greatly from SLI for some reason and we can see that this issue is still evident with the 7800 GTX in SLI mode, with only a 6% performance gain at maximum.
Far Cry - HDR, 8x AF (FPS)
640x480
800x600
1024x768
1280x1024
1600x1200
7800 GTX
77.4
77.4
77.0
61.5
43.9
6800 Ultra
76.9
75.5
61.7
40.3
24.2
7800 GTX SLI
74.4
74.8
74.8
63.7
46.6
6800 Ultra SLI
74.5
74.1
64.1
42.5
30.0
7800 GTX % Faster than 6800 Ultra
640x480
800x600
1024x768
1280x1024
1600x1200
Single
0.7%
2.5%
24.7%
52.7%
81.3%
SLI
-0.1%
1.0%
16.7%
50.0%
55.5%
% SLI Increase
640x480
800x600
1024x768
1280x1024
1600x1200
7800 GTX
-3.9%
-3.3%
-2.9%
3.6%
6.1%
6800 Ultra
-3.1%
-1.9%
3.9%
5.5%
23.6%
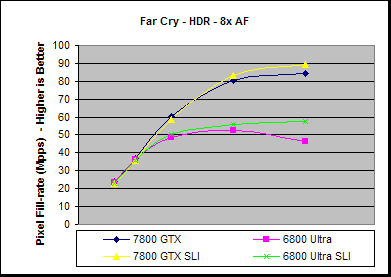
With 8x AF enabled under the HDR path we see that the 7800 GTX is able to open up a further performance advantage over the 6800 Ultra, with a maximum performance difference of 81%.