Overdraw and Stencil Tests
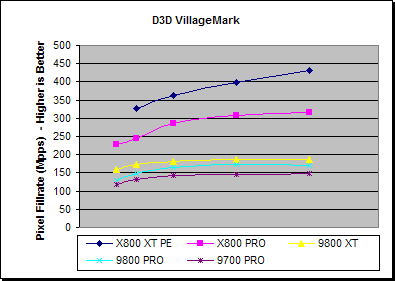
Here we'll look at the overdraw reduction and stencilling performance in a number of applications. First, we'll look at the old PowerVR "VillageMark" test which uses high degrees of multi-texturing with plenty of occluded surfaces.
| D3D VillageMark | 640x480 | 800x600 | 1024x768 | 1280x1024 | 1600x1200 |
| X800 XT PE | 682 | 461 | 304 | 225 | |
| X800 PRO | 741 | 510 | 364 | 235 | 165 |
| 9800 XT | 518 | 360 | 232 | 143 | 98 |
| 9800 PRO | 419 | 310 | 208 | 131 | 89 |
| 9700 PRO | 381 | 272 | 180 | 112 | 77 |
| X800 XT PE % Difference | 640x480 | 800x600 | 1024x768 | 1280x1024 | 1600x1200 |
| X800 PRO | 33.7% | 26.6% | 29.4% | 36.4% | |
| 9800 XT | 89.4% | 98.7% | 112.6% | 129.6% | |
| 9800 PRO | 120.0% | 121.6% | 132.1% | 152.8% | |
| 9700 PRO | 150.7% | 156.1% | 171.4% | 192.2% |
| X800 PRO % Difference | 640x480 | 800x600 | 1024x768 | 1280x1024 | 1600x1200 |
| 9800 XT | 43.1% | 41.7% | 56.9% | 64.3% | 68.4% |
| 9800 PRO | 76.8% | 64.5% | 75.0% | 79.4% | 85.4% |
| 9700 PRO | 94.5% | 87.5% | 102.2% | 109.8% | 114.3% |
You may note that the 640x480 result for the X800 XT PE under VillageMark is blank – this is due to the test calculating the average FPS with a minimum of two seconds, however as the X800 XT PE renders the test in less than two seconds a result cannot be provided!
We can see that the X800 XT PE doesn’t quite attain its theoretical fill-rate performance difference over the X800 PRO or the 9800 XT, but then from the looks of the fill-rate graph it appears the X800 XT PE is slightly system limited, whereas the R300 based Radeons are fully fill-rate limited at the higher resolutions. The X800 PRO gets closer to reaching its theoretical rate over the 9800 XT, but again it still looks slightly system limited, so it's unclear whether there have been improvements to the overdraw reduction scheme on R420 over R300 – at least it certainly appears to still be operational on the X800 PRO, even though a quad pipeline is turned off.
| % Difference from Back to Front | ||||||
| GL_REME Overdraw Test | Factor | Back to Front | Front to Back | Random | Front to Back | Random |
| X800 XT PE | 3 | 1311.7 | 4053.4 | 2177.6 | 209.0% | 66.0% |
| 8 | 486.5 | 3569.3 | 1415.5 | 633.7% | 191.0% | |
| X800 PRO | 3 | 977.2 | 3001.8 | 1642.2 | 207.2% | 68.1% |
| 8 | 370.5 | 2620.3 | 1073.5 | 607.3% | 189.8% | |
| 9800 XT | 3 | 847.6 | 2679.5 | 1415.5 | 216.1% | 67.0% |
| 8 | 309.1 | 2205.4 | 888.2 | 613.5% | 187.3% | |
| 9800 PRO | 3 | 784.2 | 2471.7 | 1304.3 | 215.2% | 66.3% |
| 8 | 284.8 | 2026.1 | 817.8 | 611.4% | 187.1% | |
| 9700 PRO | 3 | 702.75 | 2210.71 | 1168.85 | 214.6% | 66.3% |
| 8 | 255.25 | 1798.68 | 730.49 | 604.7% | 186.2% | |
Looking at the render order tests we see that the efficiency of the overdraw reduction routines appears to be very similar of all the boards, indicating that the relative efficiencies between the R300 generation and R420 are about the same. However as the R420 boards have more pipelines and more clock speed over the older boards the number of pixels they reject per cycle also increases accordingly, which shows up in terms of overall performance.
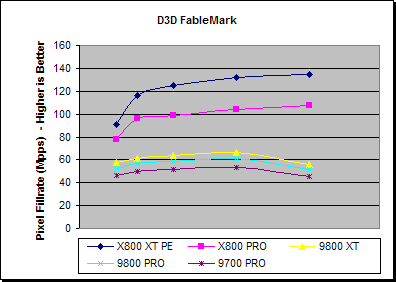
FableMark is another PowerVR test, but in this case it makes use of stencil shadows.
| D3D FableMark | 640x480 | 800x600 | 1024x768 | 1280x1024 | 1600x1200 |
| X800 XT PE | 297.2 | 242.5 | 158.8 | 100.5 | 70.3 |
| X800 PRO | 254.6 | 199.8 | 126.1 | 79.4 | 56.2 |
| 9800 XT | 188.0 | 128.4 | 80.9 | 50.6 | 29.3 |
| 9800 PRO | 171.2 | 118.7 | 74.7 | 46.6 | 27.0 |
| 9700 PRO | 150.7 | 103.8 | 65.3 | 40.8 | 23.5 |
| X800 XT PE % Difference | 640x480 | 800x600 | 1024x768 | 1280x1024 | 1600x1200 |
| X800 PRO | 16.7% | 21.4% | 25.9% | 26.6% | 25.1% |
| 9800 XT | 58.1% | 88.9% | 96.3% | 98.6% | 139.9% |
| 9800 PRO | 73.6% | 104.3% | 112.6% | 115.7% | 160.4% |
| 9700 PRO | 97.2% | 133.6% | 143.2% | 146.3% | 199.1% |
| X800 PRO % Difference | 640x480 | 800x600 | 1024x768 | 1280x1024 | 1600x1200 |
| 9800 XT | 35.4% | 55.6% | 55.9% | 56.9% | 91.8% |
| 9800 PRO | 48.7% | 68.3% | 68.8% | 70.4% | 108.1% |
| 9700 PRO | 68.9% | 92.5% | 93.1% | 94.6% | 139.1% |
Judging from the performances under Fablemark, there doesn’t appear to be too much in the way of per-cycle optimizations on R420 over R300 with respect to stencil rendering performance. However, what is interesting is that all the R300 based boards appear to take a small fill-rate drop at 1600x1200, whereas the R420 boards do not – perhaps this is because the Z/Stencil cache on the R420 is slightly larger, due to the increased number of pipelines and the R300 based boards are running over their cache size.
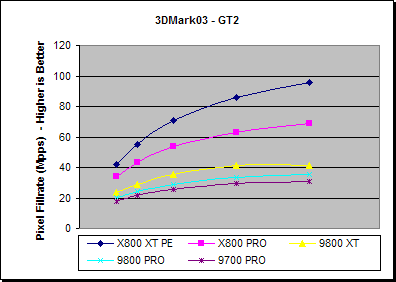
3DMark03's Game Test 2 utilises a variety of techniques, inclusive of a Z only pass and stencil shadows, in a more varied and game-like fashion.
| 3DMark02 - GT2 | 640x480 | 800x600 | 1024x768 | 1280x1024 | 1600x1200 |
| X800 XT PE | 137.4 | 114.6 | 90.0 | 65.6 | 49.8 |
| X800 PRO | 111.1 | 89.7 | 68.2 | 48.0 | 35.7 |
| 9800 XT | 75.8 | 60.7 | 45.1 | 31.7 | 21.6 |
| 9800 PRO | 65.7 | 51.1 | 37.1 | 25.5 | 18.3 |
| 9700 PRO | 57.3 | 44.7 | 32.7 | 22.3 | 16.0 |
| X800 XT PE % Difference | 640x480 | 800x600 | 1024x768 | 1280x1024 | 1600x1200 |
| X800 PRO | 23.7% | 27.8% | 32.0% | 36.7% | 39.5% |
| 9800 XT | 81.3% | 88.8% | 99.6% | 106.9% | 130.6% |
| 9800 PRO | 109.1% | 124.3% | 142.6% | 157.3% | 172.1% |
| 9700 PRO | 139.8% | 156.4% | 175.2% | 194.2% | 211.3% |
| X800 PRO % Difference | 640x480 | 800x600 | 1024x768 | 1280x1024 | 1600x1200 |
| 9800 XT | 46.6% | 47.8% | 51.2% | 51.4% | 65.3% |
| 9800 PRO | 69.1% | 75.5% | 83.8% | 88.2% | 95.1% |
| 9700 PRO | 93.9% | 100.7% | 108.6% | 115.2% | 123.1% |
Under the GT2 test from 3DMark03 we again see that the theoretical fill-rate differences are not met, but under this complex environment the X800 XT PE attains a 130% performance improvement over the 9800 XT and the X800 PRO a 65% improvement.