Overdraw and Stencil TestsHere we'll look at the overdraw reduction and stencilling performance in a number of applications. First, we'll look at the old PowerVR "VillageMark" test which uses high degrees of multi-texturing with plenty of occluded surfaces
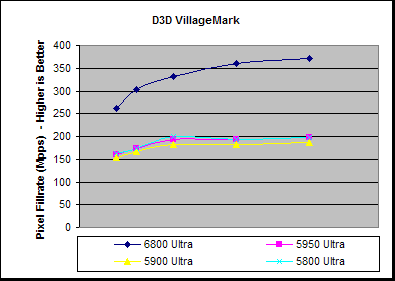
The performance difference between the 6800 Ultra and 5950 lies at around double, which is roughly equivalent to the texture rate differences. It doesn't appear that the 6800 Ultra is showing any more capable overdraw reduction abilities than 5950 in this particular test.
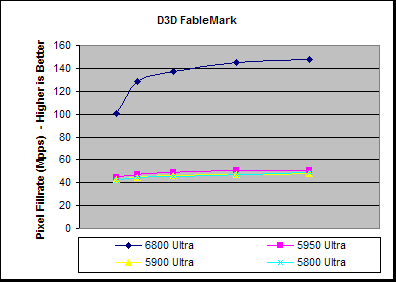
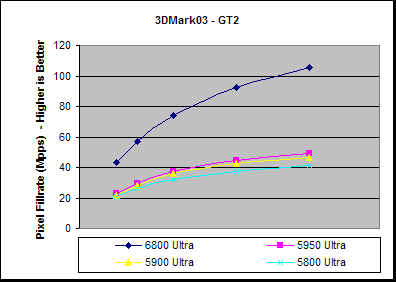
Analysing the overdraw reduction properties of these boards a little more with GL_REME we see that is the best case Front-to-Back tests the 6800 Ultra is somewhat more efficient than the 5950. However, that efficiency is reduced to below that of the 5950's improvement from Back-to-Front in the Random order rendering test - perhaps this could be due to the Z-Buffer updates with multiple pixel pipelines operating. FableMark is another PowerVR test, but in this case it makes use of stencil shadows, an area in which GeForce 6800 Ultra should excel at.
Here we see that the 6800 Ultra nearly attains three times the performance of the 5950 at higher resolutions and it even shows some system limitations at low resolution, whereas the 5950 is nigh on completely fill-rate bound across all resolutions. 3DMark03's Game Test 2 utilises a variety of techniques, inclusive of a Z only pass and stencil shadows, in a more varied and game-like fashion.
In this case the performance difference between the 6800 Ultra and the 5950 lies at around double the performance for the 6800, though it is also still attaining well over 60 FPS at 1280x1024. |
||||||||||||||||||||||||||||||||||||||||||||||||||||||||||||||||||||||||||||||||||||||||||||||||||||||||||||||||||||||||||||||||||||||||||||||||||||||||||||||||||||||||||||||||||||||||||||||||||||||||||||||||||||||||||||||||
- NVIDIA Fermi GPU and Architecture Analysis
- ATI Cypress Gaming Performance Analysis
- ATI Cypress GPU and Architecture analysis
- ATI RV740 GPU and Architecture Analysis
- NVIDIA GT200 GPU and Architecture Analysis
- Q&A with Visceral's Technical Art Director Doug Brooks on Dead Space 2
- AMD's John Bridgman on Radeon, Linux and Open Source 3D
- Dave Kirk - NVIDIA Tesla Launch
- A speculative look on the Wii U GPU
- Was Harry Potter actually into rendering? Beyond3D's first ever book review
- Diving into Anti-Aliasing
- Andy Keane Interview & Tesla Adoption/Deployment
- Travelling in Style: Beyond3D's C++ AMP contest - WINNER ANNOUNCED
- Ian Buck - NVIDIA Tesla Launch
- E3 2011: Behind Closed Doors - Witcher 2 Xbox 360... and a Nurse
NV40 - GeForce 6800 Ultra Review - Page 22
Published on 14th Apr 2004, written by Dave Baumann for Consumer Graphics - Last updated: 20th Jul 2007
Page Navigation
Site width adjust
![]()
![]()
Reset width
Privacy Policy