Games Benchmarks - DirectXUT2004The first game benchmark we'll look at is UT2004. Although UT2004 is relatively recently released, to our knowledge it is still largely based on a similar build of engine as UT2003, which means its feature set utilisation still marks it primarily as a DirectX7/8 engined title. We are using a custom Firing Squad benchmark demo. 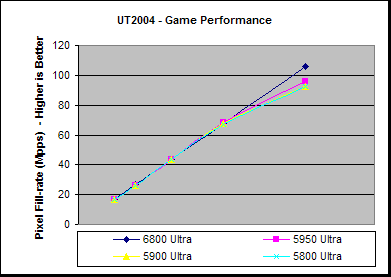
There's not really much to say here other than the fact we can see both 6800 Ultra and 5950 are very system limited in most cases, with the 5950 just beginning to show a slight fill-rate limitation at high resolution. Due to the limitations of the CPU in this test bed an average FPS much about 55 is not attainable. 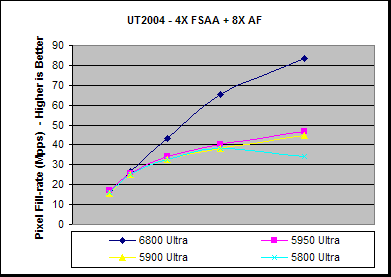
With both 4X FSAA and 8X Anisotropic Filtering (AF) enabled we see that the 5950 is quickly showing either fill-rate or bandwidth limitations. Given that the 6800 Ultra hardly budges in performance all the way up to 1600x1200 and the bandwidths of the two boards are the closest elements, we can derive that this UT2004 test is probably quite texture limited for the 5950 - although it may also be the case that the colour compression on the 6800 Ultra is working more optimally than on the 5950, hence alleviating some more of the bandwidth requirements of FSAA. 
Most of the benchmarks here are so CPU limited, that virtually all the performances are the same under the different rendering conditions, and only at 1600x1200 doe we see any slight variance. What we can see, though, is that 4X FSAA has a lower performance degradation than 8X AF in this test, highlighting that there is quite a heavy texturing overhead present. |
- NVIDIA Fermi GPU and Architecture Analysis
- ATI Cypress Gaming Performance Analysis
- ATI Cypress GPU and Architecture analysis
- ATI RV740 GPU and Architecture Analysis
- NVIDIA GT200 GPU and Architecture Analysis
- E3 2011: Behind Closed Doors - Witcher 2 Xbox 360... and a Nurse
- A speculative look on the Wii U GPU
- AMD's John Bridgman on Radeon, Linux and Open Source 3D
- Was Harry Potter actually into rendering? Beyond3D's first ever book review
- Andy Keane Interview & Tesla Adoption/Deployment
- Diving into Anti-Aliasing
- Q&A with Visceral's Technical Art Director Doug Brooks on Dead Space 2
- Travelling in Style: Beyond3D's C++ AMP contest - WINNER ANNOUNCED
- Ian Buck - NVIDIA Tesla Launch
- Dave Kirk - NVIDIA Tesla Launch
NV40 - GeForce 6800 Ultra Review - Page 23
Published on 14th Apr 2004, written by Dave Baumann for Consumer Graphics - Last updated: 20th Jul 2007
Page Navigation
Site width adjust
![]()
![]()
Reset width
Privacy Policy