Half Life 2Here we'll use Half Life 2 to test the DirectX9 rendering performance of the graphics boards in this title. We are using our own internal benchmark from a level that has a lot of shader usage in order to maximise the utilisation of the graphics board, rather than the CPU.
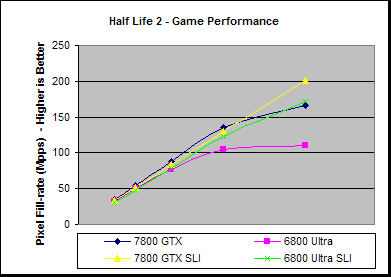
Our Half Life 2 test is beginning to show some CPU limitations at high resolutions on the 7800 GTX, but this still allows for a 53% performance increase over the 6800 Ultra which is more graphics bound. Because the SLI setups are more CPU limited the gains aren't as high as in other cases, especially not for the 7800 GTX SLI - note, again, a single 7800 GTX is very close to the performance of 6800 Ultra in SLI mode.
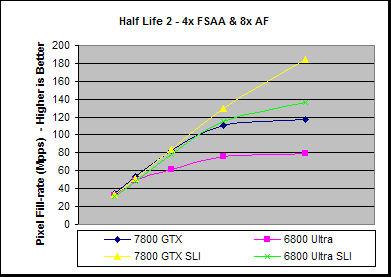
With 4x FSAA and 8x AF enabled this Half Life 2 test becomes a little more graphics limited, and whilst the differences between the 7800 and 6800 in single board mores stay at similar levels to normal rendering, there are greater gains to be had with SLI. Note that again a single 7800 GTX is only rendering 10 FPS, on average, behind the 6800 Ultra's in SLI.
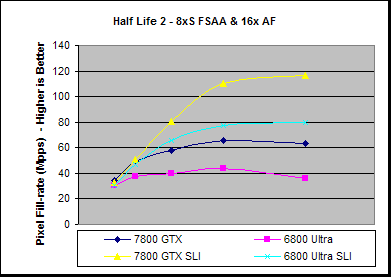
With 8xS FSAA and 16x AF enabled we can see the performance gap between the 7800 GTX and 6800 Ultra open up even further than in the other cases on this test - this could be due to the fact that 8xS requires twice as many samples to go through the fragment shaders, which the extra shader power of the 7800 GTX can handle more effectively. |
- NVIDIA Fermi GPU and Architecture Analysis
- ATI Cypress Gaming Performance Analysis
- ATI Cypress GPU and Architecture analysis
- ATI RV740 GPU and Architecture Analysis
- NVIDIA GT200 GPU and Architecture Analysis
- E3 2011: Behind Closed Doors - Witcher 2 Xbox 360... and a Nurse
- Q&A with Visceral's Technical Art Director Doug Brooks on Dead Space 2
- Andy Keane Interview & Tesla Adoption/Deployment
- Was Harry Potter actually into rendering? Beyond3D's first ever book review
- Dave Kirk - NVIDIA Tesla Launch
- Ian Buck - NVIDIA Tesla Launch
- Travelling in Style: Beyond3D's C++ AMP contest - WINNER ANNOUNCED
- A speculative look on the Wii U GPU
- Diving into Anti-Aliasing
- AMD's John Bridgman on Radeon, Linux and Open Source 3D
G70: NVIDIA GeForce 7800 GTX Review - Page 16
Published on 22nd Jun 2005, written by Dave Baumann for Consumer Graphics - Last updated: 19th Jul 2007
Page Navigation
Site width adjust
![]()
![]()
Reset width
Privacy Policy