Doom 3 "Turkey Baster"Our Doom 3 "Turkey Baster" test uses and extended sequence from the Alpha Labs 1 level and is intended to be used in Doom 3's Ultra mode as a slightly heavier stress test as this level has a few areas where texture swapping will occur on 256MB boards.
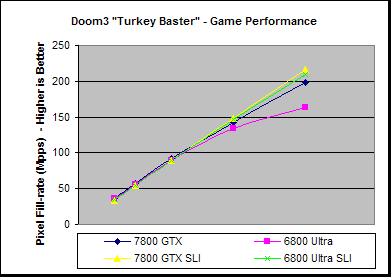
Thanks to the performance of these boards we can see that this test is also CPU limited for the most part, with only the 6800 Ultra displaying much of a graphics limitation that enables the 7800 GTX to have a 20% performance difference at high resolutions.
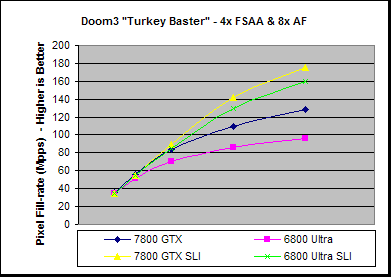
With 4x FSAA and 8x AF enabled the test does become a little less system limited, such that the 7800 GTX opens up a 34% performance advantage over the 6800 Ultra, staying above an average of 60 FPS at 1600x1200. |
- NVIDIA Fermi GPU and Architecture Analysis
- ATI Cypress Gaming Performance Analysis
- ATI Cypress GPU and Architecture analysis
- ATI RV740 GPU and Architecture Analysis
- NVIDIA GT200 GPU and Architecture Analysis
- Ian Buck - NVIDIA Tesla Launch
- Diving into Anti-Aliasing
- Q&A with Visceral's Technical Art Director Doug Brooks on Dead Space 2
- E3 2011: Behind Closed Doors - Witcher 2 Xbox 360... and a Nurse
- AMD's John Bridgman on Radeon, Linux and Open Source 3D
- Travelling in Style: Beyond3D's C++ AMP contest - WINNER ANNOUNCED
- A speculative look on the Wii U GPU
- Andy Keane Interview & Tesla Adoption/Deployment
- Was Harry Potter actually into rendering? Beyond3D's first ever book review
- Dave Kirk - NVIDIA Tesla Launch
G70: NVIDIA GeForce 7800 GTX Review - Page 18
Published on 22nd Jun 2005, written by Dave Baumann for Consumer Graphics - Last updated: 19th Jul 2007
Page Navigation
Site width adjust
![]()
![]()
Reset width
Privacy Policy