BenchmarksTheoretical RatesBefore going on to look at any actual benchmarks scores we'll take a look at the theoretical metrics of the GeForce 7800 GTX in relation to the 6800 Ultra.
The core clock rate on the 7800 GTX is only an extra 30MHz over the 6800 Ultra, or 7.5% greater. The increased number of internal pipelines, in conjunction with the increased clock rate, equates to a texture fill-rate advantage of 61% to the 7800 GTX in relation to the 6800Ultra - bear in mind that the number of fragment shader ALU's also scales with this metric, so we are looking for cases above 61% to see how effective the changes to the fragment shaders have been. With the higher clock speed and two extra vertex shaders the geometry rate of the 7800 GTX is 43% greater than the 6800 Ultra - again, we are looking for improvements beyond this in order to see how effective the changes to the vertex shader and fixed function elements of the geometry pipeline have been. Finally, the bus width stays the same between the two boards so the bandwidth increase is scaling just with the different clocks rates. Fill-RatesHere we'll take a look at some of the key fill-rate characteristics of the 7800 GTX.
The colour fill-rate performance differences between the two boards are fairly small, which is little surprise as they have the same number of ROP's and only small differences in core and memory clock rates - still the difference is a little less than both of those metrics. As with the colour fill-rate, the Z fill-rate doesn't appear to change much between these two boards in this test, but the double Z rate is still evident. The Single Texture Alpha Blend rate has fairly significantly improved, probably partially due to the increased texturing abilities, but also we see that the rate is above half the colour performance, which may indicate that all the ROP's have blending capabilities which may not have been the case with 6800. The floating point texture fill-rate is also increased fairly significantly, but this is in-line with the texture performance improvements
Looking at the fill-rates with Multi-Sampling AntiAliasing enabled we see the colour fill-rate stays the same as its default fill-rate at 2x FSAA, whilst the Z rate drops to the same level. The colour and Z fill-rate drop down again at 4x FSAA highlighting that each pixel requires two clocks to generate the 4 samples, which means that each ROP is capable of outputting two samples per cycle.
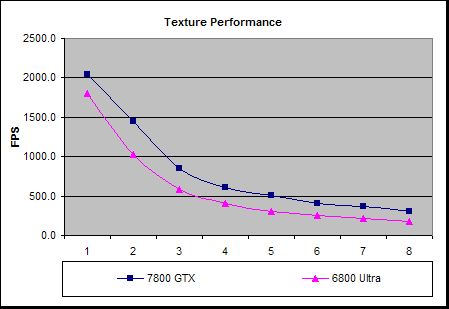
Whilst 6800 has a 1:1 texture to ROP ratio, 7800 has a higher texture rate than it does ROP output, so with single texturing the performance gap between them is not much better than the clock rate differences. When more textures are applied per pixel we see that the gap between the two opens up as the texture rate advantage the 7800 has is able to show itself more as the ROP's are no longer a limitation as more cycles are being used internally to apply the layers. |
- NVIDIA Fermi GPU and Architecture Analysis
- ATI Cypress Gaming Performance Analysis
- ATI Cypress GPU and Architecture analysis
- ATI RV740 GPU and Architecture Analysis
- NVIDIA GT200 GPU and Architecture Analysis
- Diving into Anti-Aliasing
- Q&A with Visceral's Technical Art Director Doug Brooks on Dead Space 2
- A speculative look on the Wii U GPU
- Travelling in Style: Beyond3D's C++ AMP contest - WINNER ANNOUNCED
- Was Harry Potter actually into rendering? Beyond3D's first ever book review
- Dave Kirk - NVIDIA Tesla Launch
- Ian Buck - NVIDIA Tesla Launch
- AMD's John Bridgman on Radeon, Linux and Open Source 3D
- Andy Keane Interview & Tesla Adoption/Deployment
- E3 2011: Behind Closed Doors - Witcher 2 Xbox 360... and a Nurse
G70: NVIDIA GeForce 7800 GTX Review - Page 7
Published on 22nd Jun 2005, written by Dave Baumann for Consumer Graphics - Last updated: 20th Jul 2007
Page Navigation
Site width adjust
![]()
![]()
Reset width
Privacy Policy