Z Rejection PerformanceDependant on the organisation of the pipelines the Z rejection rate may scale with the shader pipelines. We'll take a look using the GL_REME application that test various render orders, looking at them in relation to the back to front order, which is the worst case scenario for early pixel rejection.
Here we see that although the 7800 GTX has a higher performance in each of the modes, the 7800 GTX isn't quite as efficient as the 6800 Ultra. The difference is not significant enough to suggest that there is much in the way of differences between the two but perhaps there is a little loss of efficiency due to the wider pipeline of the 7800. Stencil PerformanceGame Test 2 in Futuremark's benchmark application 3DMark03 uses an early Z pass and stencil buffered shadows, so we'll look at the rendering performance of the 7800 GTX in this to see how it fares in relation to the 6800 Ultra in a stencil heavy scene.
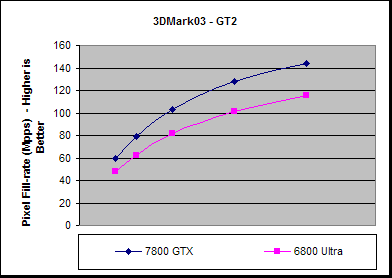
As we've seen before, the double Z rate of previous NVIDIA parts carries across to G70 hence the 7800 GTX still has a performance advantage over the 6800 Ultra in this test. The difference is, in fact, larger than the pure stencil performance difference would suggest, which is likely due to the increased shader capabilities. |
||||||||||||||||||||||||||||||||||||||||||||||||||||||||||||||||||
- NVIDIA Fermi GPU and Architecture Analysis
- ATI Cypress Gaming Performance Analysis
- ATI Cypress GPU and Architecture analysis
- ATI RV740 GPU and Architecture Analysis
- NVIDIA GT200 GPU and Architecture Analysis
- Q&A with Visceral's Technical Art Director Doug Brooks on Dead Space 2
- Ian Buck - NVIDIA Tesla Launch
- Dave Kirk - NVIDIA Tesla Launch
- Was Harry Potter actually into rendering? Beyond3D's first ever book review
- Travelling in Style: Beyond3D's C++ AMP contest - WINNER ANNOUNCED
- A speculative look on the Wii U GPU
- Andy Keane Interview & Tesla Adoption/Deployment
- Diving into Anti-Aliasing
- E3 2011: Behind Closed Doors - Witcher 2 Xbox 360... and a Nurse
- AMD's John Bridgman on Radeon, Linux and Open Source 3D
G70: NVIDIA GeForce 7800 GTX Review - Page 8
Published on 22nd Jun 2005, written by Dave Baumann for Consumer Graphics - Last updated: 20th Jul 2007
Page Navigation
Site width adjust
![]()
![]()
Reset width
Privacy Policy