UT2003 - Flyby
Here we'll look at the Flyby scores of Unreal Tournament 2003's benchmark, under DirectX.
| 640x480 | 800x600 | 1024x768 | 1280x960 | 1600x1200 |
| Normal | 52.3 | 53.1 | 52.3 | 45.4 | 38.3 |
| 3XFSAA | 42.7 | 34.4 | 24.7 | 16.1 | 12.6 |
| % Diff | -18% | -35% | -53% | -65% | -67% |
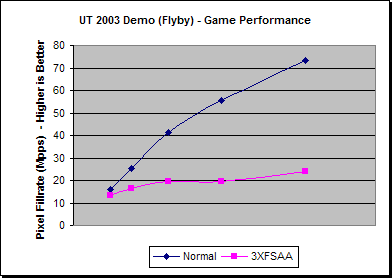
The UT2003 Flyby benchmark usually proves itself to be fairly fill-rate limited, and yet in this instance that does not appear to be the completely case under normal rendering. The low scores in the low resolutions would tend to indicate that the T&L unit of the board isn't being utilised effectively here.
The FSAA performance tells a different story, in that it is more fill-rate limited, loosing as much as 67% of the performance. Again, we can see in the fill-rate graph that there is is a little hump in the fill-rate performance at 1600x1200, which could indicate that some settings have been lowered.
| 640x480 | 800x600 | 1024x768 | 1280x960 | 1600x1200 | |
| P4 2.53GHz | 52.3 | 53.1 | 52.3 | 45.4 | 38.3 |
| P4 1.8GHz | 38.1 | 38.0 | 37.3 | 35.4 | 32.3 |
| % Diff | -27% | -29% | -29% | -22% | -16% |
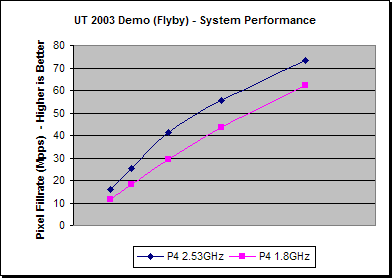
The difference in performance between the two systems further underlines what was said earlier. As opposed to being primarily fill-rate limited, the P4 1.8GHz system is nearly completely CPU limited in the UT2003 Flyby demo, which is atypical for this demo, unless hardware geometry processing is either not present, not being utilised or very inefficient.
| 640x480 | 800x600 | 1024x768 | 1280x960 | 1600x1200 | |
| AGP4X | 52.7 | 52.5 | 52.0 | 47.8 | 41.0 |
| AGP8X | 52.3 | 53.1 | 52.3 | 45.4 | 38.3 |
| % Diff | -0.9% | 1.1% | 0.7% | -5.1% | -6.6% |
The difference in performance between AGP4X and AGP8X is a bit of a mixed bag on this occasion, however as we saw with Dungeon Siege, there are a few performance drops, as opposed to gains.