UT2003 - Botmatch
Here we'll look at the Botmatch element of the UT2003 benchmark.
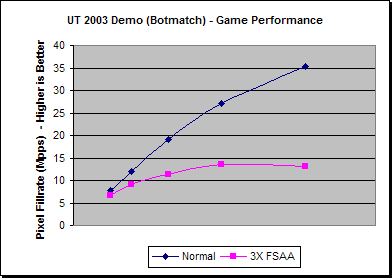
| 640x480 | 800x600 | 1024x768 | 1280x960 | 1600x1200 | |
| Normal | 25.3 | 25.2 | 24.3 | 22.2 | 18.4 |
| 3X FSAA | 21.4 | 18.9 | 14.3 | 11.0 | 6.8 |
| % Diff | -15% | -25% | -41% | -50% | -63% |
Unlike the Flyby benchmark, the Botmatch element of UT2003 is more inline with the results we've seen before, if a little on the low side even for a low-end board. Enabling 3XFSAA brings the performance down by as much as 63% in high resolutions.
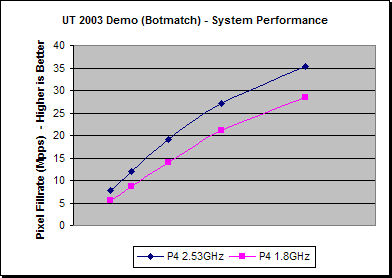
| 640x480 | 800x600 | 1024x768 | 1280x960 | 1600x1200 | |
| P4 2.53GHz | 25.3 | 25.2 | 24.3 | 22.2 | 18.4 |
| P4 1.8GHz | 18.2 | 18.1 | 17.7 | 17.1 | 14.9 |
| % Diff | -28% | -28% | -27% | -23% | -19% |
The performance difference on the two different CPU's again highlights the dependence on the CPU in the Botmatch benchmark, with this board. The 1.8GHz P4 looses 28% to the 2.53GHz P4 at 640x480, sinking to 19% deficit at 1600x1200.
| 640x480 | 800x600 | 1024x768 | 1280x960 | 1600x1200 | |
| AGP4X | 25.1 | 25.0 | 24.1 | 22.5 | 18.8 |
| AGP8X | 25.3 | 25.2 | 24.3 | 22.2 | 18.4 |
| % Diff | 0.6% | 0.7% | 0.6% | -1.5% | -2.1% |
Here we can see that in the lower resolutions, where the CPU/system performance is tested more, hence a wider bus between the system to graphics board is more beneficial, we can see that AGP8X is indeed providing a small gain in performance. Oddly, though, this once again sinks to a slight deficit at the higher resolutions where the system is more limited by the fill-rate of the graphics board.