Application Analysis using the Performance Dashboard
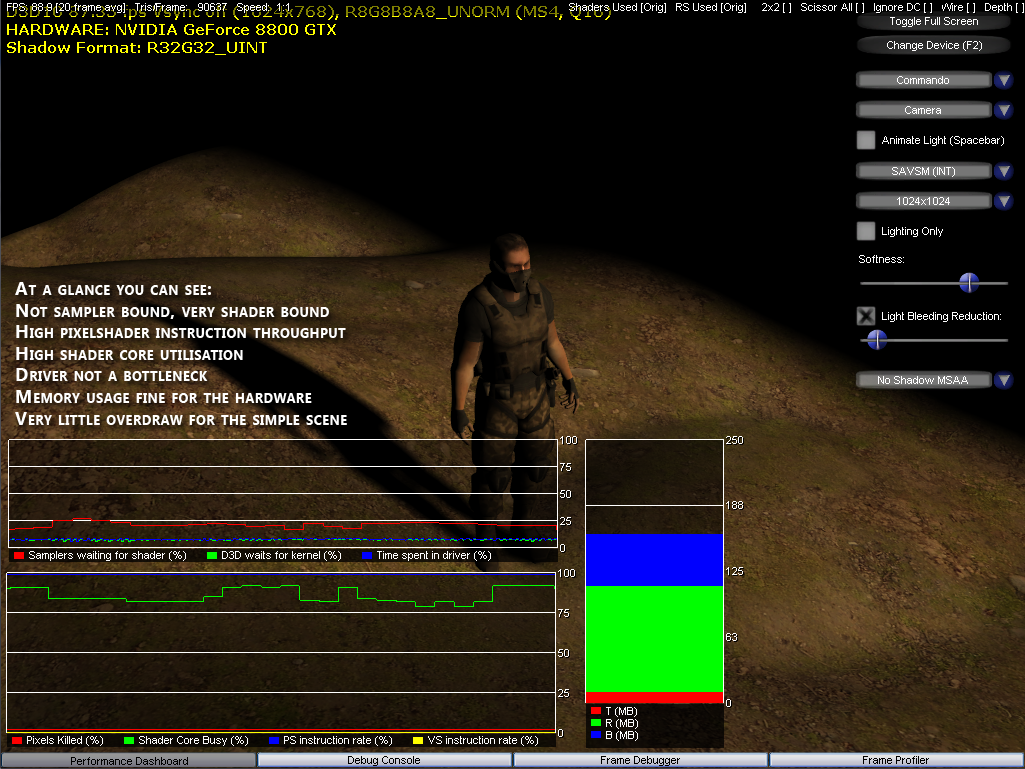
Andy's SATVSM implementation, if you look at the shader code, outwardly appears to be (and is) very pixelshader heavy, with low VS usage and no GS usage, and the demo harness he created is a simple one. Therefore if it's running correctly, you'd expect -- when monitoring the right signals -- to see high PS throughput and high usage of the entire shader core on NVIDIA's latest unified shader core designs.
Because the shadow maps that the algorithm creates and samples from can be large, it's also a good idea to take a look at memory usage, the sampler busy or wait rate, and signals to see if the driver is behaving and isn't a bottleneck when doing the work to enable the creation of the large resources. PerfHUD makes that simple. You can clear the default overlays and start from scratch, or augment what's there, by right clicking with PerfHUD enabled and showing the Performance Dashboard.
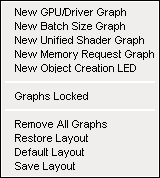
"New GPU/Driver Graph" creates a blank graph to which you can attach the display of up to four driver or hardware signals, each with user defineable labels. The other additional overlays should be self explanatory. We used the ability to create a new overlay setup using that right click menu to look at what we outlined above, while running Andy's demo.
The list of signals available in PerfHUD is too numerous to list here, and the PerfHUD User Guide doesn't list them either which can be a hindrance, but the list is comprehensive and hopefully easily understood by developers as far as getting real-time feedback from the GPU, driver and D3D runtime during execution of your application goes.
Update
NVIDIA have let us know that the signal list will be made available in the user guide at least, and possibly the NVIDIA developer subsite.
Our app-specific overlay, sampling the right signals we need, shows us what we're looking for. 100% PS instruction rate, greater than 75% shader core utilisation, low sampler utilisation, the driver not getting in the way and memory usage for our 1Kx1K integer SATVSM setup are all visible at a glance. It's a simple demo of a shadowing technique, rather than a full game, so we're not concerned with monitoring things like our draw call budget (we draw the entire frame in less than two dozen draw calls here, and you can see we're drawing less than 100K triangles).
But that said, signals to monitor specifics for a frame or frame sequence analysis are all attachable to custom graph overlays which you can resize, either as absolute value reports or percentages (we normalise to percentages in our displays as you can see, and the driver does that for you correctly).
The overlays scroll signal samples from right to left over time, at a speed that matches framerate, and in the Performance Dashboard view you can speed up or slow down time via PerfHUD hooking the Windows performance counter API, reporting time samples using that API back to your application with modification. If you use the performance counter API for timing information in your application, PerfHUD can therefore affect animation speeds, which might be useful for your frame analysis.
You also have a range of quick hotkey-driven adjustments, which PerfHUD calls experiments, so you can make to help you quickly identify some common bottlenecks. You have access to wireframe rendering, replacing all textures with 2x2 versions to see if the sampler hardware is holding you back (2x2 textures will always be read entirely out of cache), forcing output of PS revisions to certain colours to see which shaders are running on which pixels, and you can force geometry rendering to null to unload VS processing.
So for example, because we're not sampler bound here, setting 2x2 textures or removing draw calls doesn't affect our framerate too much with the PS-heavy SATVSM shaders running. That confirms, although it was visible already, that we are definitely PS bound. NVIDIA provide a flow matrix to help you diagnose things to get the best balance in your app. The Performance Dashboard is only one facet of what PerfHUD can do, too.