Application Analysis using the Frame Debugger
The Frame Debugger in PerfHUD is arguably its most useful asset, despite the HUD part that gives it its name being front and center. We get the impression that if you were to ask developers that use PerfHUD for tuning and analysis of shipping games, the Frame Debugger will have been responsible for the lion's share of performance finding and visual debugging. It lets you step through a frame, draw call by draw call, monitoring resources per call while showing you the visual contribution each call makes, while the frame is built by your renderer.
Indeed, we've heard anecdotal evidence of the Frame Debugger's usefulness on more than one occasion, the most famous being an unnamed studio's realisation that they were drawing the frame twice before present. Scrubbing through the frame call by call showed the frame finished by the midpoint on the scrubber's timeline, and fixing made the framerate increase by the expected 2x. The Frame Debugger can help in identifying more subtle effects too.
In our case using Andy's demo, the Frame Debugger let us see the shadow map contents after generation and while sampling, and let us check that the map was being generated at the right point in the frame, after all geometry had been generated. Crucially, it also let us try out in-frame shader adjustments, while the application was running. You can get to a point mid-frame, while it's being built, and edit the shader in-place (although it causes a frame reset), and scrub back to that same point quickly to see the effects.
Here are screenshots showing both frame scrub through effects, resource viewing during frame analysis including our example's shadow map, and in-place shader editing.

So there we are after the first draw call, a tiny subset of our geometry drawn into a rendertarget for depth (one car in the convoy scene).
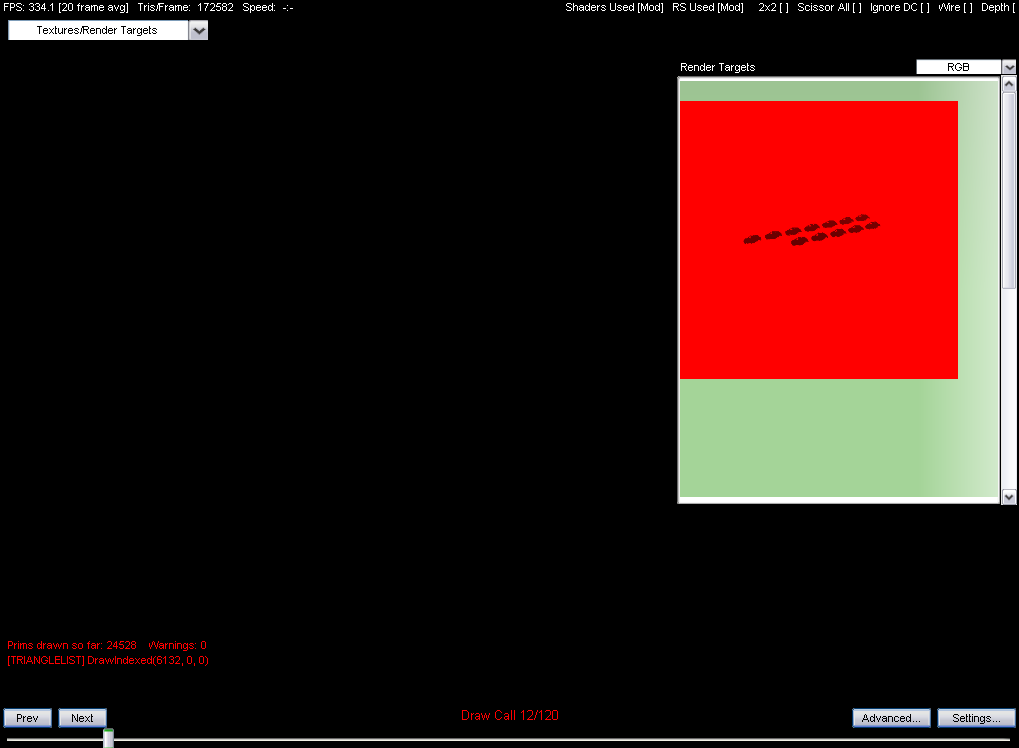
11 draw calls later and we the depth contribution of 11 more cars into the RT. That's the basics of what frame scrubbing gets you, as you advance through the frame. Textures and RTs are visible on the left and right of the screen, and you can make the views of those resources bigger or smaller depending on what you want to focus on. That applies to resource viewing in the other advanced state inspectors, which we touch on below.
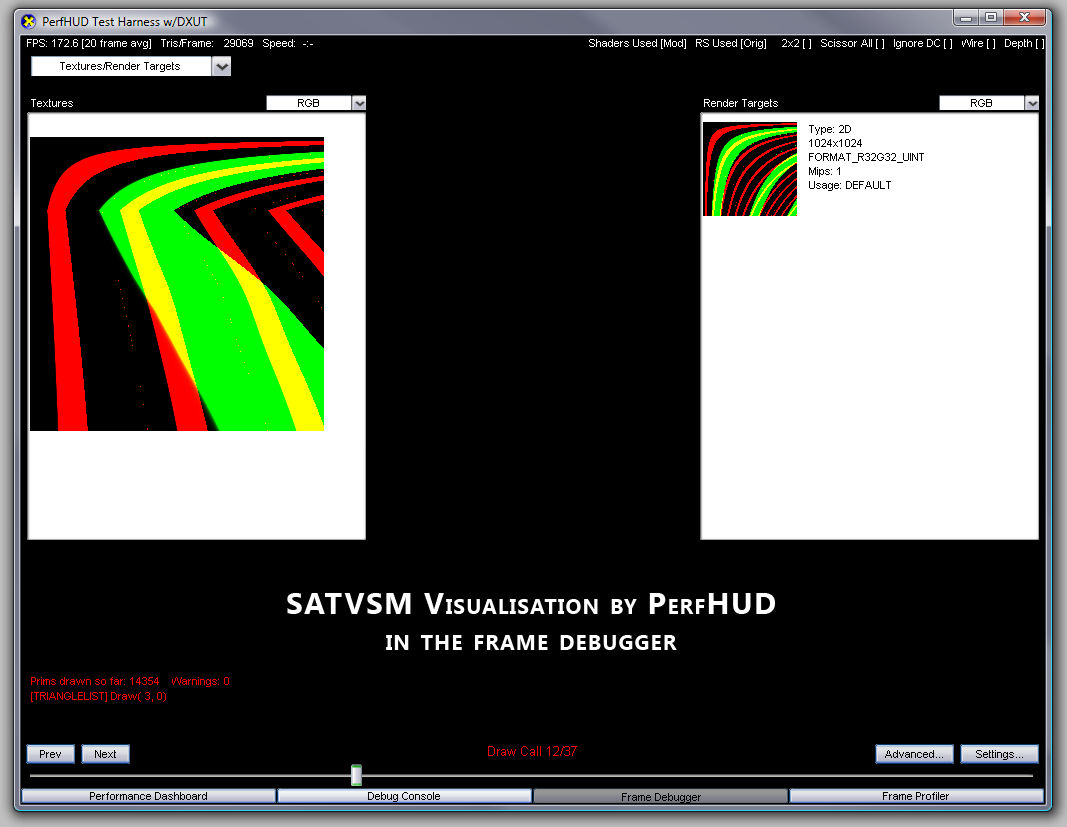
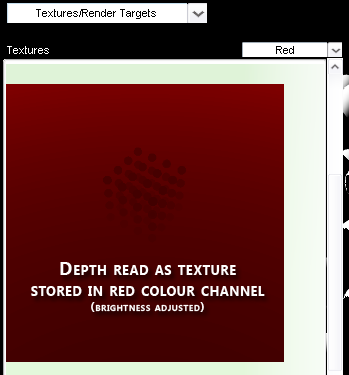
Here we see the shadow map distribution in the RT, in this case in the red and green channels of Andy's integer SATVSM implementation.
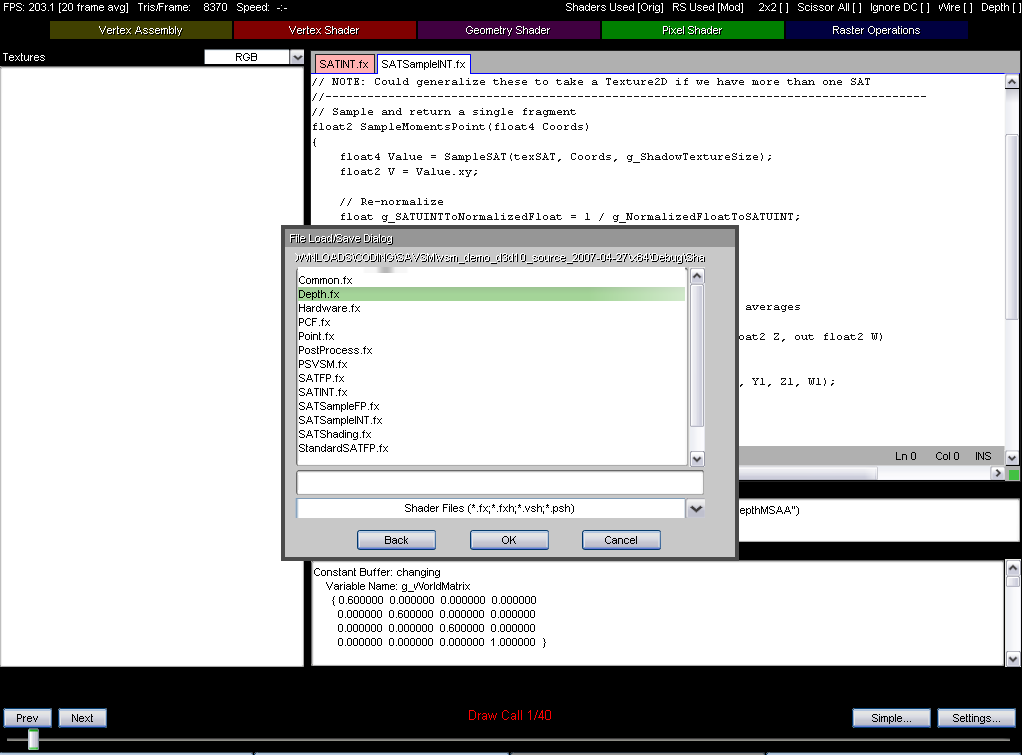
For any given point in the frame you can also load the shaders used to draw it (providing your application is submitting them to the driver in uncompiled form), edit them, reset the frame and see the contribution. By default, PerfHUD only shows you the last shader used to affect the scene, but right clicking lets you load others as you can see.
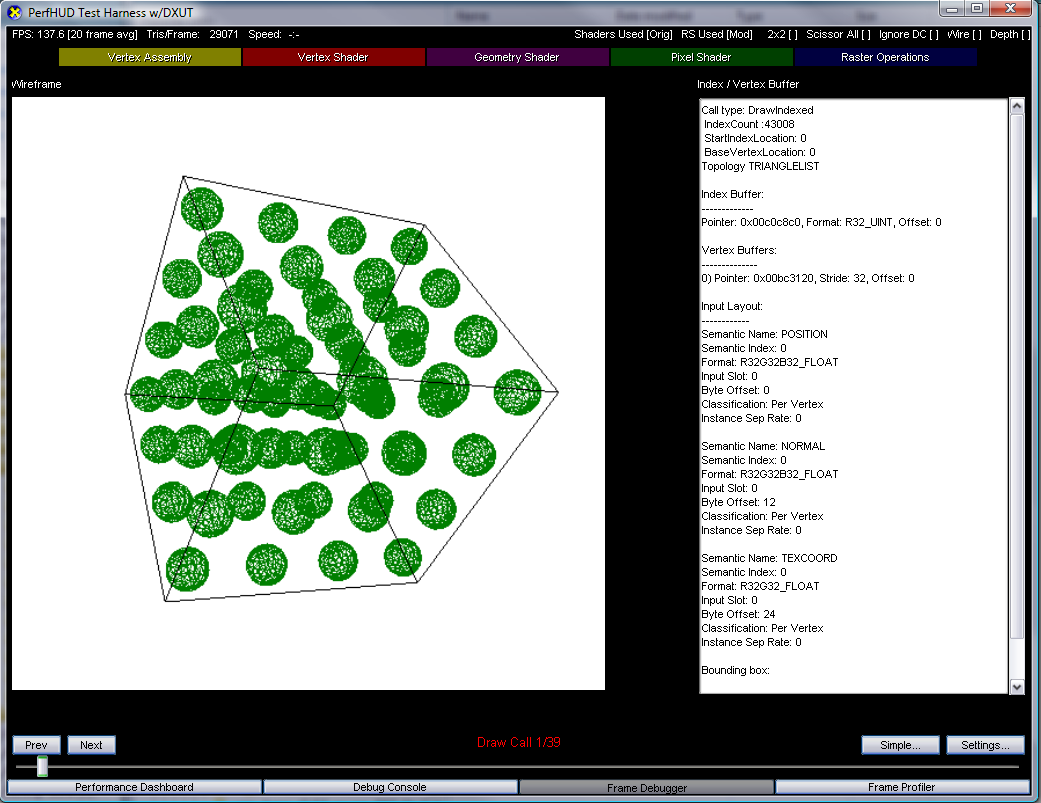
You can also see the geometry being assembled, rotating your view to make sure the triangles you were expecting are being submitted for drawing.
In our shadow mapping demo case, rendering of depth is key to the effect working properly. So being able to see the depth contribution in the Frame Debugger as a resource is a win, although we wish that PerfHUD let you save those resources to files for external analysis and viewing, since you never get a full-size view and sometimes the exact per-pixel or per-vertex detail is what's key. Maybe a feature for a future version.
Finally, PerfHUD also gives you access to raster state, letting you change things mid-frame as its being built. If you're only changing one or two parameters then usage of that part of the Frame Debugger is fine. We'd certainly prefer it however if you could save and load raster state changes more easily, to make the feature easier to use and more consistent. Memorising the changes to make, because they're easily reset if you alter things, if they're numerous is a potential hindrance.
That brings us on to our main usability gripe with the Frame Debugger. If you're doing an analysis or debug run in PerfHUD using the FD, where it's being done as a repeated cycle following changes in your app code, a recompile, and a new instance launch in PerfHUD, it'd be nice to be able to script or otherwise load a set of state for FD that says something like "go to call 987, adjust these raster settings, enlarge this resource and load these shaders into the editor".
At its core, however, the FD is a nice place to spend time, and it's probably PerfHUD's biggest strength in depth despite obvious usage flaws and faults.